Structural variation analysis was carried out on barley and structural variation data between 25 barley genomes and the reference genome morex was obtained, and in this data it is possible to know which intervals have certain structural variants. By taking the intersection, this database obtains the positions of multiple genomes that have the same variation as the reference genome at the same time, and by scoring the number of genomes containing structural variation at the same position, we can obtain the scoring value of the structural variation in each interval, which is the definition of ‘annotation score’.
Annotation types were referred from Syri file format

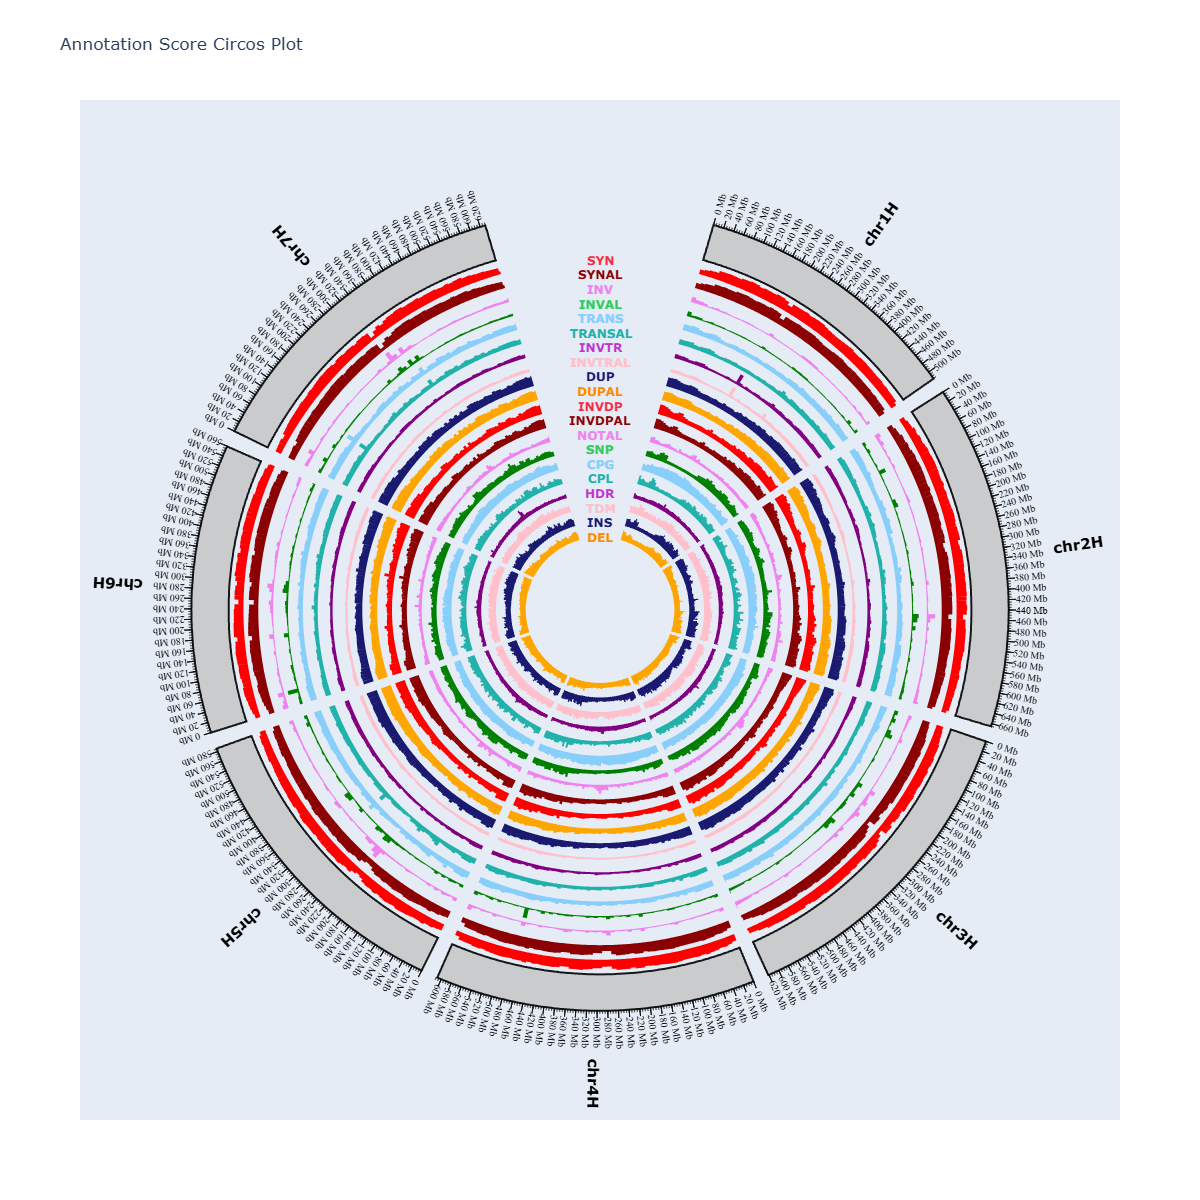
The following figure shows the average value of the annotation score within the 10 Mb interval. Click on the figure to view an interactive image